このヒープメモリはいったい誰が確保したものなのか、を調べる方法(Windows, C 言語)
メモリリークの故障解析などで、「このアドレスのヒープメモリはいったい誰が確保したものなのか」を知りたくなる場合があると思います。そんなときは Windows の設定を変更しておくと、メモリ確保時の呼び出し履歴が自動的に記録されます。
動作確認環境
- Windows 11 Home 22H2
- Visual Studio Community 2022 (Visual C++)
- WinDbg 10.0
- GFlags (Global Flags)
GFlags で設定変更
まず、WinDbg と一緒にインストールされる GFlags ツールを起動します [1]。32 ビット版と 64 ビット版があるので、調査対象のプロセスと同じビット数のものを使います。
64 ビット版:
C:\Program Files (x86)\Windows Kits\10\Debuggers\x64\gflags.exe

32 ビット版:
C:\Program Files (x86)\Windows Kits\10\Debuggers\x86\gflags.exe
今回は 64 ビット版を起動します。
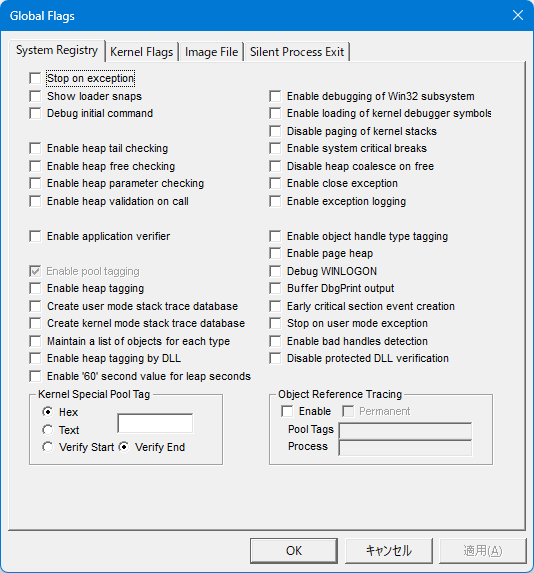
起動画面です。
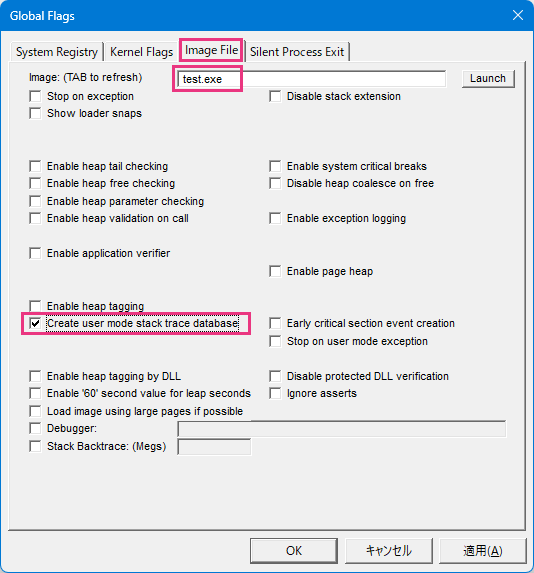
調査委対象プロセスが「test.exe」の場合、[Image File] タブをクリックし、[Image] 欄に「test.exe」と入力し、[Tab] キーを押します。そして、 [Create user mode stack trace database] のチェックボックスを選択し、[OK] を押します。
これで環境設定が終わりました。
実際に行われたのは、単なるレジストリの変更です。
具体的には、次のレジストリキー配下に、
HKLM\SOFTWARE\Microsoft\Windows NT\CurrentVersion\Image File Execution Options「test.exe」という名前のサブキーが作られ、「GlobalFlag」として「0x1000」が書き込まれただけです。
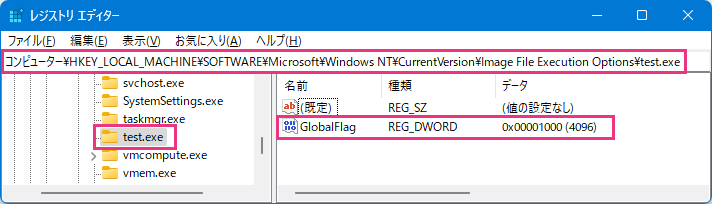
したがって、GFlags ツールを使わなくてもレジストリエディタの編集で同じ設定ができます。
メモリを確保するプログラムの実行
ヒープメモリを確保するプログラムを作成し、実行します。
今回は次のプログラムを「c:\tmp\test.c」として用意しました。「main() → func1() → func2() → malloc()」と呼び出してメモリを確保しています。その後、main() に戻り、確保したメモリのアドレスを表示し、キー入力待ちになります。
#include <stdio.h>
#include <windows.h>

void *func2(void)
{
    return malloc(100);
}

void *func1(void)
{
    return func2();
}

int main(void)
{
    char *p = (char *)func1();
    printf("0x%p\n", p);
    getchar();

    return 0;
}
「x64 Native Tools Command Prompt for VS 2022」のコマンドプロンプトを開き、ビルドします。「/Od」は最適化抑止、「/Zi」はデバッグ情報を生成の意味です。
C:\tmp> cl /Od /Zi test.c
Microsoft(R) C/C++ Optimizing Compiler Version 19.31.31105 for x64
Copyright (C) Microsoft Corporation.  All rights reserved.

test.c
Microsoft (R) Incremental Linker Version 14.31.31105.0
Copyright (C) Microsoft Corporation.  All rights reserved.

/out:test.exe
/debug
test.obj
「test.exe」ができました。
実行します。
C:\tmp> test.exe
0x000001D8E584AE30


C:\tmp>
確保したメモリのアドレスが表示され、キー入力待ちになり、[Enter] キー押下で終了しました。
しかしこれでは呼び出し履歴はわかりません。WinDbg を使ってプログラム実行時のメモリを覗く必要があります。
WinDbg で呼び出し履歴を参照する
WinDbg を使ってプログラム実行時のメモリを覗く方法はいくつかあります。
- 【方法 1】 WinDbg 上でプログラムを実行する。たとえば、WinDbg を起動し、メニューの [File]-[Open Executable…] から目的のプログラムを選択し、実行する。
- 【方法 2】 実行中のプログラムに WinDbg をアタッチする。たとえば、プログラム実行中に WinDbg を起動し、メニューの [File]-[Attach to a Process…] から目的のプログラムを選択する。
- 【方法 3】 プログラムのダンプファイルを取得し WinDbg で開く。たとえば、タスクマネージャーの[詳細]タブから目的のプロセスを右クリックして[メモリダンプファイルの作成]を行い、WinDbg の [File]-[Open Crash Dump…」からそのダンプファイルを開く(ただし、上 2 つの方法と違ってプロセスは死んでいる)。
ここでは【方法 2】を使います。
「test.exe」を実行します。
C:\tmp> test.exe
0x00000221CEA7AE30
確保したメモリの先頭アドレス「0x00000221CEA7AE30」が表示され、キー入力待ちになりました。
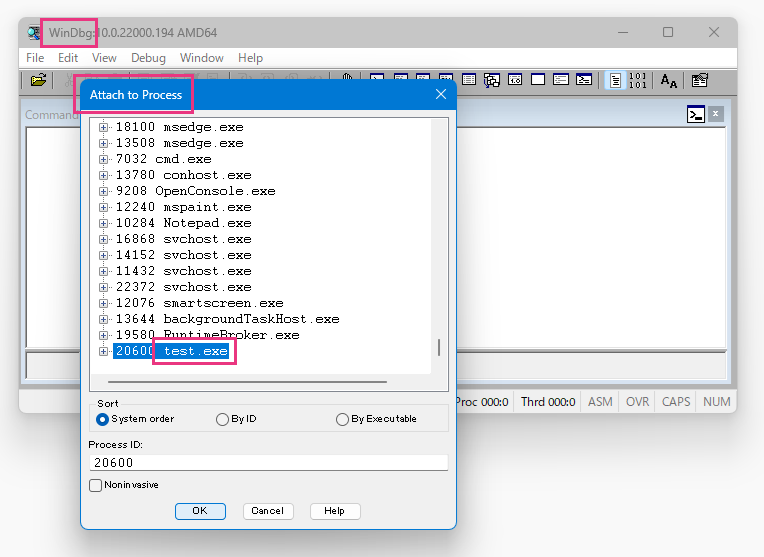
WinDbg を起動し、メニューの [File]-[Attach to a Process…] から「test.exe」を選択してアタッチします。
[Command] ウィンドウにて以下の 3 つのコマンドを入力し、シンボルをロードします。いつものお約束です。
0:001> !sym noisy  ★ シンボルファイルのダウンロードの様子を表示するよう指示
noisy mode - symbol prompts on

0:001> .symfix c:\symbols  ★ シンボルファイルのダウンロード先を設定
DBGHELP: Symbol Search Path: SRV*c:\symbols*https://msdl.microsoft.com/download/symbols
......

0:001> .reload /f  ★ シンボルファイルの強制ダウンロード
Reloading current modules
......
次がポイントです。[Command] ウィンドウにて、「!heap -p -a <確保したメモリのアドレス>」と入力します。
0:001> !heap -p -a 18AA0FFAE30  ★ 末尾に確保したヒープメモリのアドレスを指定
    address 0000018aa0ffae30 found in
    _HEAP @ 18aa0fe0000
              HEAP_ENTRY Size Prev Flags            UserPtr UserSize - state
        0000018aa0ffae00 0009 0000  [00]   0000018aa0ffae30    00064 - (busy)
        7ffd157cd072 ntdll!RtlpAllocateHeapInternal+0x00000000000809e2
        7ff66e5cb674 test!_malloc_base+0x0000000000000044  ★ malloc() の実体
        7ff66e1e95ce test!func2+0x000000000000000e         ★ func2()
        7ff66e1e95e9 test!func1+0x0000000000000009         ★ func1()
        7ff66e1e9609 test!main+0x0000000000000009          ★ main()
        7ff66e57e1f8 test!__scrt_common_main_seh+0x000000000000010c
        7ffd145a257d KERNEL32!BaseThreadInitThunk+0x000000000000001d
        7ffd1576aa58 ntdll!RtlUserThreadStart+0x0000000000000028
        ★ 上記アドレスは、call 命令のアドレスではなく、call 命令から帰ってきたときのリターンアドレス。
これが当該アドレスのヒープメモリ確保時の呼び出し履歴になります。
下から順に見ていくと、main() に入って func1() に入って func2() に入って malloc() が呼び出されたことが見て取れます。
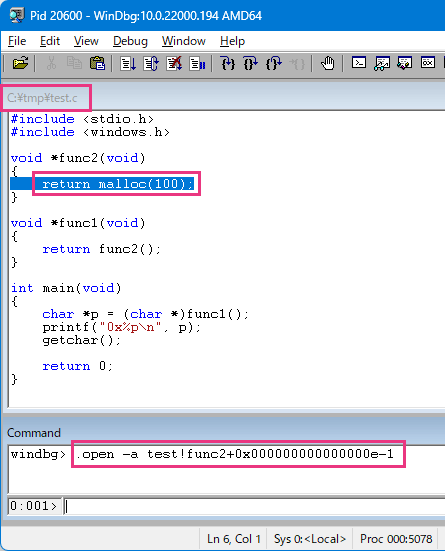
「test.exe」のシンボルファイル「test.pdb」が正しく作成・参照されていれば、リターンアドレスのひとつ前の命令を「ub <リターンアドレス> L1」で逆アセンブルすることで、ソース内の行番号もわかります。
0:001> ub test!main+0x0000000000000009 L1  ★ ub は指定のアドレスより前を逆アセンブル、L1 は1行分の意味
test!main+0x4 [C:\tmp\test.c @ 16]:  ★ c:\tmp\test.c の 16 行目
00007ff6`6e1e9604 e88faa1aff      call    test!ILT+12435(func1) (00007ff6`6d394098)

0:001> ub test!func1+0x0000000000000009 L1
test!func1+0x4 [C:\tmp\test.c @ 11]:  ★ c:\tmp\test.c の 11 行目
00007ff6`6e1e95e4 e8aaaa1aff      call    test!ILT+12430(func2) (00007ff6`6d394093)

0:001> ub test!func2+0x000000000000000e L1
test!func2+0x9 [C:\tmp\test.c @ 6]:  ★ c:\tmp\test.c の 6 行目
00007ff6`6e1e95c9 e836941aff      call    test!ILT+6655(malloc) (00007ff6`6d392a04)
手元にソースがある場合は、「.open -a <リターンアドレス>-1」で行位置を調べてもいいでしょう。
なぜ呼び出し履歴がわかるのか
なぜ呼び出し履歴がわかるのでしょうか。
通常の malloc() の動作をステップ実行で追ってみると、RtlpAllocateHeapInternal() を介して RtlpAllocateHeap() を呼び出し、この中で実際のヒープメモリを確保していることがわかります。
0:000> kc
 # Call Site
00 ntdll!RtlpAllocateHeap  ★ ヒープメモリを確保
01 ntdll!RtlpAllocateHeapInternal
02 test!_malloc_base  ★ malloc() の実体
03 test!func2
04 test!func1
05 test!main
......
一方、GFlags で [Create user mode stack trace database] を設定した場合の malloc() の動作を追ってみると、同じく RtlpAllocateHeapInternal() を介して RtlpAllocateHeap() を呼び出していますが、
0:000> kc
 # Call Site
00 ntdll!RtlpAllocateHeap  ★ ヒープメモリを確保
01 ntdll!RtlpAllocateHeapInternal
02 test!_malloc_base  ★ malloc() の実体
03 test!func2
04 test!func1
05 test!main
......
そのほかに RtlCaptureStackBackTrace() を呼び出しています。
0:000> kc
# Call Site
00 ntdll!RtlCaptureStackBackTrace ★ 呼び出し履歴を取得
01 ntdll!RtlpStackTraceDatabaseLogPrefix
02 ntdll!RtlpAllocateHeapInternal
03 test!_malloc_base ★ malloc() の実体
04 test!func2
05 test!func1
06 test!main
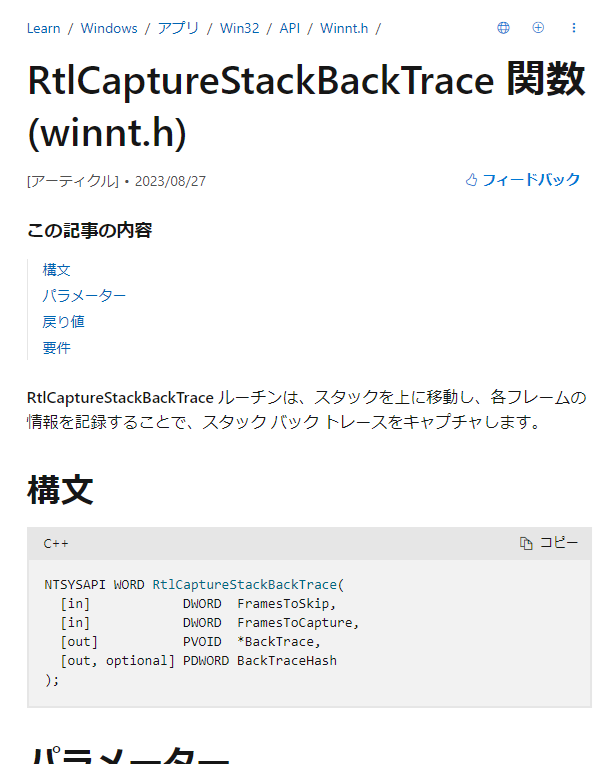
......RtlCaptureStackBackTrace() は、各フレームのリターンアドレスの一覧、要するに呼び出し履歴を取得する関数です [2]。
そして、取得した呼び出し履歴をメモリ内の特定の場所に memcpy() で保存しています。
0:000> kc
 # Call Site
00 ntdll!memcpy  ★ 呼び出し履歴を特定の場所に保存
01 ntdll!RtlpRegisterStackTrace
02 ntdll!RtlpStackTraceDatabaseLogPrefix
03 ntdll!RtlpAllocateHeapInternal
04 test!_malloc_base  ★ malloc() の実体
05 test!func2
06 test!func1
07 test!main
......
保存された呼び出し履歴の例です。呼び出し履歴のリターンアドレスが並んでいます。
0:000> r rcx
rcx=000001ed347f90c0  ★ memcpy() の第 1 引数 = コピー先アドレス

0:000> gu  ★ memcpy() の処理を完了させ、呼び出し元に戻る
ntdll!RtlpRegisterStackTrace+0x176:
00007ffd`158285a6 488bc7          mov     rax,rdi

0:000> dq 1ed347f90c0  ★ memcpy() で保存した呼び出し履歴
000001ed`347f90c0  00007ffd`157cd072 00007ff6`5d67b674  ★ リターンアドレスの羅列
000001ed`347f90d0  00007ff6`5d2995ce 00007ff6`5d2995e9  ★ リターンアドレスの羅列
000001ed`347f90e0  00007ff6`5d299609 00007ff6`5d62e1f8  ★ リターンアドレスの羅列
000001ed`347f90f0  00007ffd`145a257d 00007ffd`1576aa58  ★ リターンアドレスの羅列
000001ed`347f9100  00000000`00000000 00000000`00000000
000001ed`347f9110  00000000`00000000 00000000`00000000
000001ed`347f9120  00000000`00000000 00000000`00000000
000001ed`347f9130  00000000`00000000 00000000`00000000
「!heap -p -a」は、このリターンアドレスを参照してアドレスとシンボルを表示しています。
0:001> !heap -p -a 1ED348FED70
    address 000001ed348fed70 found in
    _HEAP @ 1ed348f0000
              HEAP_ENTRY Size Prev Flags            UserPtr UserSize - state
        000001ed348fed40 0009 0000  [00]   000001ed348fed70    00064 - (busy)
        ★ 以下のアドレスは、コピー先アドレスの中身と同一。
        ★ コピー先アドレスの中身を書き換えると、以下の情報も書き換わる。
        7ffd157cd072 ntdll!RtlpAllocateHeapInternal+0x00000000000809e2
        7ff65d67b674 test!_malloc_base+0x0000000000000044
        7ff65d2995ce test!func2+0x000000000000000e
        7ff65d2995e9 test!func1+0x0000000000000009
        7ff65d299609 test!main+0x0000000000000009
        7ff65d62e1f8 test!__scrt_common_main_seh+0x000000000000010c
        7ffd145a257d KERNEL32!BaseThreadInitThunk+0x000000000000001d
        7ffd1576aa58 ntdll!RtlUserThreadStart+0x0000000000000028
このように、GFlags を設定すると malloc() の内部動作が変わりメモリ確保の都度都度呼び出し履歴を保存するようになるので、あとから呼び出し履歴がたどれるというわけです。
保存される呼び出し履歴の深さは
保存される呼び出し履歴の深さはいかほどでしょうか。
先のプログラムを少し書き換え、「main() → func1() を再帰を使って 300 回呼び出す → func2() → malloc()」という動作に変更します。
#include <stdio.h>
#include <windows.h>

void *func2(void)
{
    return malloc(100);
}

void *func1(int count)
{
    if (1 < count)
    {
        return func1(count - 1);
    }
    else
    {
        return func2();
    }
}

int main(void)
{
    char *p = (char *)func1(300); // 300 回再帰
    printf("0x%p\n", p);
    getchar();

    return 0;
}
ビルドして実行します。
C:\tmp> cl /Od /Zi test.c
......

C:\tmp> test.exe
0x000001ABD6D3AE30
WinDbg をアタッチし、当該アドレスのメモリ確保時の呼び出し履歴を見てみます。
0:001> !heap -p -a 1ABD6D3AE30
    address 000001abd6d3ae30 found in
    _HEAP @ 1abd6d20000
              HEAP_ENTRY Size Prev Flags            UserPtr UserSize - state
        000001abd6d3ae00 0009 0000  [00]   000001abd6d3ae30    00064 - (busy)
        7ffd157cd072 ntdll!RtlpAllocateHeapInternal+0x00000000000809e2  ★ 深さ 1
        7ff62fd6b674 test!_malloc_base+0x0000000000000044  ★ 深さ 2
        7ff62f9895ce test!func2+0x000000000000000e  ★ 深さ 3
        7ff62f989605 test!func1+0x0000000000000025  ★ 深さ 4
        7ff62f9895fc test!func1+0x000000000000001c  ★ 深さ 5
        7ff62f9895fc test!func1+0x000000000000001c  ★ 深さ 6
        7ff62f9895fc test!func1+0x000000000000001c  ★ 深さ 7
        7ff62f9895fc test!func1+0x000000000000001c  ★ 深さ 8
        7ff62f9895fc test!func1+0x000000000000001c  ★ 深さ 9
        7ff62f9895fc test!func1+0x000000000000001c  ★ 深さ 10
        7ff62f9895fc test!func1+0x000000000000001c  ★ 深さ 11
        7ff62f9895fc test!func1+0x000000000000001c  ★ 深さ 12
        7ff62f9895fc test!func1+0x000000000000001c  ★ 深さ 13
        7ff62f9895fc test!func1+0x000000000000001c  ★ 深さ 14
        7ff62f9895fc test!func1+0x000000000000001c  ★ 深さ 15
        7ff62f9895fc test!func1+0x000000000000001c  ★ 深さ 16
        7ff62f9895fc test!func1+0x000000000000001c  ★ 深さ 17
        7ff62f9895fc test!func1+0x000000000000001c  ★ 深さ 18
        7ff62f9895fc test!func1+0x000000000000001c  ★ 深さ 19
        7ff62f9895fc test!func1+0x000000000000001c  ★ 深さ 20
        7ff62f9895fc test!func1+0x000000000000001c  ★ 深さ 21
        7ff62f9895fc test!func1+0x000000000000001c  ★ 深さ 22
        7ff62f9895fc test!func1+0x000000000000001c  ★ 深さ 23
        7ff62f9895fc test!func1+0x000000000000001c  ★ 深さ 24
        7ff62f9895fc test!func1+0x000000000000001c  ★ 深さ 25
        7ff62f9895fc test!func1+0x000000000000001c  ★ 深さ 26
        7ff62f9895fc test!func1+0x000000000000001c  ★ 深さ 27
        7ff62f9895fc test!func1+0x000000000000001c  ★ 深さ 28
        7ff62f9895fc test!func1+0x000000000000001c  ★ 深さ 29
        7ff62f9895fc test!func1+0x000000000000001c  ★ 深さ 30
        7ff62f9895fc test!func1+0x000000000000001c  ★ 深さ 31
        7ff62f9895fc test!func1+0x000000000000001c  ★ 深さ 32
        ★ 実際はさらに「多数の func1()」や「main()」の連鎖がある
最後の 32 個分しか表示されませんでした。それより深い呼び出し履歴は捨てられるようです。
保存される呼び出し履歴の最大サイズは
多数のヒープメモリを確保した場合、そのすべての呼び出し履歴が保存されるのでしょうか。それとも、古い情報は破棄されるのでしょうか。
ヒープメモリを 100 万回確保するプログラムを作ります。
#include <stdio.h>
#include <windows.h>

void *func2(void)
{
    return malloc(10);
}

void *func1(int count)
{
    if (1 < count)
    {
        return func1(count - 1);
    }
    else
    {
        return func2();
    }
}

int main(void)
{
    char *p;

    for (int i = 0; i < 1000000; i++) // 100 万回ループ
    {
        p = func1(28);     // 28 回再帰
        if (i % 1000 == 0) // アドレスの表示は 1000 回に 1 回だけにしておく
        {
            printf("%p\n", p);
        }
    }
    getchar();

    return 0;
}
ビルドして実行します。
C:\tmp> cl /Od /Zi test.c
......

C:\tmp> test.exe
00000274B23E20A0  ★ i == 0
00000274B23F87C0
00000274B2406150
00000274B2418DD0
00000274B2427AB0
00000274B24394E0
00000274B2449310
00000274B2456D20
00000274B24672D0
00000274B2478B00  ★ i == 9000
... 中略 ...
00000274B63CCFA0
00000274B63DC220
00000274B63ED7E0  ★ i == 999000
WinDbg をアタッチし、いくつかのアドレスに対してメモリ確保時の呼び出し履歴を見てみます。
0:001> !heap -p -a 00000274B23E20A0  ★ i == 0 のとき
    address 00000274b23e20a0 found in
    _HEAP @ 274b23d0000
              HEAP_ENTRY Size Prev Flags            UserPtr UserSize - state
        00000274b23e2070 0004 0000  [00]   00000274b23e20a0    0000a - (busy)
          unknown!printable
        7ffd157cd072 ntdll!RtlpAllocateHeapInternal+0x00000000000809e2
        7ff63309b674 test!_malloc_base+0x0000000000000044  ★ malloc() の実体
        7ff632cb967e test!func2+0x000000000000000e  ★ func2()
        7ff632cb96b5 test!func1+0x0000000000000025  ★ func1() で再帰から脱出したところ
        7ff632cb96ac test!func1+0x000000000000001c  ★ func1() の再帰
        7ff632cb96ac test!func1+0x000000000000001c  ★ func1() の再帰
        7ff632cb96ac test!func1+0x000000000000001c  ★ func1() の再帰
        ... 中略。test!func1+0x000000000000001c が計 27 回。...
        7ff632cb96ac test!func1+0x000000000000001c  ★ func1() の再帰
        7ff632cb96ac test!func1+0x000000000000001c  ★ func1() の再帰
        7ff632cb96ac test!func1+0x000000000000001c  ★ func1() の再帰
        7ff632cb96ec test!main+0x000000000000002c   ★ main()

0:001> !heap -p -a 00000274B2478B00  ★ i == 9000 のとき
    address 00000274b2478b00 found in
    _HEAP @ 274b23d0000
              HEAP_ENTRY Size Prev Flags            UserPtr UserSize - state
        00000274b2478ad0 0004 0000  [00]   00000274b2478b00    0000a - (busy)
        7ffd157cd072 ntdll!RtlpAllocateHeapInternal+0x00000000000809e2
        7ff63309b674 test!_malloc_base+0x0000000000000044
        7ff632cb967e test!func2+0x000000000000000e
        7ff632cb96b5 test!func1+0x0000000000000025
        7ff632cb96ac test!func1+0x000000000000001c
        7ff632cb96ac test!func1+0x000000000000001c
        7ff632cb96ac test!func1+0x000000000000001c
        ... 中略。test!func1+0x000000000000001c が計 27 回。...
        7ff632cb96ac test!func1+0x000000000000001c
        7ff632cb96ac test!func1+0x000000000000001c
        7ff632cb96ac test!func1+0x000000000000001c
        7ff632cb96ec test!main+0x000000000000002c

0:001> !heap -p -a 00000274B63ED7E0  ★ i == 999000 のとき
    address 00000274b63ed7e0 found in
    _HEAP @ 274b23d0000
              HEAP_ENTRY Size Prev Flags            UserPtr UserSize - state
        00000274b63ed7b0 0004 0000  [00]   00000274b63ed7e0    0000a - (busy)
        7ffd157cd072 ntdll!RtlpAllocateHeapInternal+0x00000000000809e2
        7ff63309b674 test!_malloc_base+0x0000000000000044
        7ff632cb967e test!func2+0x000000000000000e
        7ff632cb96b5 test!func1+0x0000000000000025
        7ff632cb96ac test!func1+0x000000000000001c
        7ff632cb96ac test!func1+0x000000000000001c
        7ff632cb96ac test!func1+0x000000000000001c
        ... 中略。test!func1+0x000000000000001c が計 27 回。...
        7ff632cb96ac test!func1+0x000000000000001c
        7ff632cb96ac test!func1+0x000000000000001c
        7ff632cb96ac test!func1+0x000000000000001c
        7ff632cb96ec test!main+0x000000000000002c
どれも適切に記録されています。そして、プログラムの作り上、すべての呼び出し履歴が同じです。
ここでもしやと思って調べたところ、確保したアドレスごとに呼び出し履歴を保存しているのではなく、ひとつの呼び出し履歴を共有していることがわかりました。
呼び出し履歴を保存しているメモリの内容を一箇所書き換えると、すべての呼び出し履歴が連動して変わってしまいます。
0:001> eq 00000274`b22690a0 1234cdef  ★ 呼び出し履歴内のメモリを適当なリターンアドレスに書き換え

0:001> !heap -p -a 00000274B23E20A0  ★ i == 0 のとき
        ......
        7ffd157cd072 ntdll!RtlpAllocateHeapInternal+0x00000000000809e2
        7ff63309b674 test!_malloc_base+0x0000000000000044
        7ff632cb967e test!func2+0x000000000000000e
        7ff632cb96b5 test!func1+0x0000000000000025
        1234cdef +0x000000001234cdef  ★ 書き換わった
        7ff632cb96ac test!func1+0x000000000000001c
        7ff632cb96ac test!func1+0x000000000000001c
        7ff632cb96ac test!func1+0x000000000000001c
        ......

0:001> !heap -p -a 00000274B2478B00  ★ i == 9000 のとき
        ......
        7ff63309b674 test!_malloc_base+0x0000000000000044
        7ff632cb967e test!func2+0x000000000000000e
        7ff632cb96b5 test!func1+0x0000000000000025
        1234cdef +0x000000001234cdef  ★ 書き換わった
        7ff632cb96ac test!func1+0x000000000000001c
        7ff632cb96ac test!func1+0x000000000000001c
        7ff632cb96ac test!func1+0x000000000000001c
        ......

0:001>  !heap -p -a 00000274B63ED7E0  ★ i == 999000 のとき
       ......
        7ffd157cd072 ntdll!RtlpAllocateHeapInternal+0x00000000000809e2
        7ff63309b674 test!_malloc_base+0x0000000000000044
        7ff632cb967e test!func2+0x000000000000000e
        7ff632cb96b5 test!func1+0x0000000000000025
        1234cdef +0x000000001234cdef  ★ 書き換わった
        7ff632cb96ac test!func1+0x000000000000001c
        7ff632cb96ac test!func1+0x000000000000001c
        7ff632cb96ac test!func1+0x000000000000001c
        ......
WinDbg.exe と一緒にインストールされる umdh.exe ツールを使って呼び出し履歴を見てみても、呼び出し履歴「BackTrace」に割り振られた番号が同一です。
C:\tmp> set _NT_SYMBOL_PATH=srv*c:\symbols*http://msdl.microsoft.com/download/symbols;c:\tmp

C:\tmp> "C:\Program Files (x86)\Windows Kits\10\Debuggers\x64\umdh.exe" -pn:test.exe
......
A bytes + 36 at 274B23E1C20 by BackTraceB22692F4  ★ BackTraceB22692F4 として保存された呼び出し履歴
	7FFD157CD072  ★ ntdll!RtlpAllocateHeapInternal+0x00000000000809e2
	7FF63309B674  ★ test!_malloc_base+0x0000000000000044
	7FF632CB967E  ★ test!func2+0x000000000000000e
	7FF632CB96B5  ★ test!func1+0x0000000000000025
	7FF632CB96AC  ★ test!func1+0x000000000000001c
	7FF632CB96AC  ★ test!func1+0x000000000000001c
	7FF632CB96AC  ★ test!func1+0x000000000000001c
        ... 中略。7FF632CB96AC が計 27 回。...
	7FF632CB96AC  ★ test!func1+0x000000000000001c
	7FF632CB96AC  ★ test!func1+0x000000000000001c
	7FF632CB96AC  ★ test!func1+0x000000000000001c
	7FF632CB96EC  ★ test!main+0x000000000000002c
......
A bytes + 36 at 274B23E20A0 by BackTraceB22692F4  ★ i == 0 のときの呼び出し履歴 → BackTraceB22692F4 を参照
A bytes + 36 at 274B23F87C0 by BackTraceB22692F4
A bytes + 36 at 274B2406150 by BackTraceB22692F4
A bytes + 36 at 274B2418DD0 by BackTraceB22692F4
A bytes + 36 at 274B2427AB0 by BackTraceB22692F4
A bytes + 36 at 274B24394E0 by BackTraceB22692F4
A bytes + 36 at 274B2449310 by BackTraceB22692F4
A bytes + 36 at 274B2456D20 by BackTraceB22692F4
A bytes + 36 at 274B24672D0 by BackTraceB22692F4
A bytes + 36 at 274B2478B00 by BackTraceB22692F4  ★ i == 9000 のときの呼び出し履歴 → BackTraceB22692F4 を参照
......
A bytes + 36 at 274B63CCFA0 by BackTraceB22692F4
A bytes + 36 at 274B63DC220 by BackTraceB22692F4
A bytes + 36 at 274B63ED7E0 by BackTraceB22692F4  ★ i == 999000 のときの呼び出し履歴 → BackTraceB22692F4 を参照
......
※ test.exe の実行結果に合わせて並べ替えています。
これでは保存される呼び出し履歴のサイズの調査になりません。
プログラムを変更し、「p = func1(28);」を 100 万回書きます。力技です。
#include <stdio.h>
#include <windows.h>

void *func2(void)
{
    return malloc(10);
}

void *func1(int count)
{
    if (1 < count)
    {
        return func1(count - 1);
    }
    else
    {
        return func2();
    }
}

int main(void)
{
    char *p;

    p = func1(28); printf("%p\n", p);
    p = func1(28);
    p = func1(28);
    p = func1(28);
    p = func1(28);
    p = func1(28);
    p = func1(28);
    p = func1(28);
    p = func1(28);
    p = func1(28);
    ... 同様の func1() 呼び出しを合計 100 万行書く。...
   ... ただし、1000 回に 1 回、アドレスを表示。...
    p = func1(28);
    p = func1(28);
    p = func1(28);
    p = func1(28);
    p = func1(28);
    p = func1(28);
    p = func1(28);
    p = func1(28);
    p = func1(28);
    p = func1(28);

    getchar();

    return 0;
}
ビルドして実行します。
C:\tmp> cl /Od /Zi test.c
......

C:\tmp> test.exe
00000205628B6B20  ★ 1 回目
00000205628C8B60
00000205628D1920
00000205628E7940
00000205628F8D30
00000205629083A0
00000205629185F0
00000205629284A0
0000020562938290
0000020562946BC0  ★ 9001 回目
... 中略 ...
0000020508ADC420
0000020508AEDC20
0000020508AFCAA0  ★ 999001 回目
WinDbg をアタッチし、いくつかのアドレスに対してメモリ確保時の呼び出し履歴を見てみます。
0:001> !heap -p -a 00000205628B6B20  ★ 1 回目
    address 00000205628b6b20 found in
    _HEAP @ 20562890000
              HEAP_ENTRY Size Prev Flags            UserPtr UserSize - state
        00000205628b6af0 0004 0000  [00]   00000205628b6b20    0000a - (busy)
        7ffd157cd072 ntdll!RtlpAllocateHeapInternal+0x00000000000809e2
        7ff682bab674 test!_malloc_base+0x0000000000000044  ★ malloc() の実体
        7ff68197713e test!func2+0x000000000000000e  ★ func2()
        7ff681977175 test!func1+0x0000000000000025  ★ func1() の再帰から脱出したところ
        7ff68197716c test!func1+0x000000000000001c  ★ func1() の再帰
        7ff68197716c test!func1+0x000000000000001c  ★ func1() の再帰
        7ff68197716c test!func1+0x000000000000001c  ★ func1() の再帰
        ... 中略。test!func1+0x000000000000001c が計 27 回。...
        7ff68197716c test!func1+0x000000000000001c  ★ func1() の再帰
        7ff68197716c test!func1+0x000000000000001c  ★ func1() の再帰
        7ff68197716c test!func1+0x000000000000001c  ★ func1() の再帰
        7ff68197ac17 test!main+0x0000000000003a97   ★ main() のオフセット 0x3a97

0:001> !heap -p -a 0000020562946BC0  ★ 9001 回目
    address 0000020562946bc0 found in
    _HEAP @ 20562890000
              HEAP_ENTRY Size Prev Flags            UserPtr UserSize - state
        0000020562946b90 0004 0000  [00]   0000020562946bc0    0000a - (busy)
        7ffd157cd072 ntdll!RtlpAllocateHeapInternal+0x00000000000809e2
        7ff682bab674 test!_malloc_base+0x0000000000000044
        7ff68197713e test!func2+0x000000000000000e
        7ff681977175 test!func1+0x0000000000000025
        7ff68197716c test!func1+0x000000000000001c
        7ff68197716c test!func1+0x000000000000001c
        7ff68197716c test!func1+0x000000000000001c
        ... 中略。test!func1+0x000000000000001c が計 27 回。...
        7ff68197716c test!func1+0x000000000000001c
        7ff68197716c test!func1+0x000000000000001c
        7ff68197716c test!func1+0x000000000000001c
        7ff68199bc08 test!main+0x0000000000024a88   ★ main() のオフセット 0x24a88

0:001> !heap -p -a 0000020508AFCAA0  ★ 999001 回目
    address 0000020508afcaa0 found in
    _HEAP @ 20562890000
              HEAP_ENTRY Size Prev Flags            UserPtr UserSize - state
        0000020508afca70 0004 0000  [00]   0000020508afcaa0    0000a - (busy)
        7ffd157cd072 ntdll!RtlpAllocateHeapInternal+0x00000000000809e2
        7ff682bab674 test!_malloc_base+0x0000000000000044
        7ff68197713e test!func2+0x000000000000000e
        7ff681977175 test!func1+0x0000000000000025
        7ff68197716c test!func1+0x000000000000001c
        7ff68197716c test!func1+0x000000000000001c
        7ff68197716c test!func1+0x000000000000001c
        ... 中略。test!func1+0x000000000000001c が計 27 回。...
        7ff68197716c test!func1+0x000000000000001c
        7ff68197716c test!func1+0x000000000000001c
        7ff68197716c test!func1+0x000000000000001c
        7ff6827c9596 test!main+0x0000000000e52416   ★ main() のオフセット 0xe52416
それぞれで異なる呼び出し履歴が表示されました(main() 内のリターンアドレスが異なる)。
umdh.exe ツールを使って呼び出し履歴を見てみても、アドレスごとに固有の「Backtrace」が記録されていることがわかります。
C:\tmp> set _NT_SYMBOL_PATH=srv*c:\symbols*http://msdl.microsoft.com/download/symbols;c:\tmp

C:\tmp> "C:\Program Files (x86)\Windows Kits\10\Debuggers\x64\umdh.exe" -pn:test.exe
......
A bytes + 36 at 205628B6B20 by BackTrace629B4EE5  ★ 1 回目
	7FFD157CD072
	7FF682BAB674
	7FF68197713E
	7FF681977175
	7FF68197716C
	7FF68197716C
	7FF68197716C
        ... 中略。7FF68197716C が計 27 回。...
	7FF68197716C
	7FF68197716C
	7FF68197716C
	7FF68197AC17  ★ test!main+0x0000000000003a97 = main() のオフセット 0x3a97
......
A bytes + 36 at 20562946BC0 by BackTrace62EAF7A5  ★ 9001 回目
	7FFD157CD072
	7FF682BAB674
	7FF68197713E
	7FF681977175
	7FF68197716C
	7FF68197716C
	7FF68197716C
        ... 中略。7FF68197716C が計 27 回。...
	7FF68197716C
	7FF68197716C
	7FF68197716C
	7FF68199BC08  ★ test!main+0x0000000000024a88 = main() のオフセット 0x24a88
......
A bytes + 36 at 20508AFCAA0 by BackTraceA080525  ★ 999001 回目
	7FFD157CD072
	7FF682BAB674
	7FF68197713E
	7FF681977175
	7FF68197716C
	7FF68197716C
	7FF68197716C
        ... 中略。7FF68197716C が計 27 回。...
	7FF68197716C
	7FF68197716C
	7FF68197716C
	7FF6827C9596  ★ test!main+0x0000000000e52416 = main() のオフセット 0xe52416
呼び出し履歴の格納には「ポインタのサイズ 8 バイト × 呼び出し履歴の深さ 32 × 100 万回」で 244 MB 以上、実際には管理領域も含めより多くのメモリが使われているはずですが、上限には達しませんでした。呼び出し履歴はメモリの許す限り保存されるように見えます。
Web で調べると、StackTraceDatabaseSizeInMB というレジストリ値で上限を設定できそうだったのですが、試した限り、効果を確認できませんでした。
malloc() 以外でのヒープメモリ確保
malloc() だけでなく、HeapAlloc(), GlobalAlloc(), LocalAlloc() でもヒープメモリを確保できます。同じだとは思いますが、念のため各関数を呼び出すプログラムを作って呼び出し履歴が取得できるか確認します。
#include <stdio.h>
#include <windows.h>

int main(void)
{
    char *p;

    p = malloc(10);
    printf("malloc, p=%p\n", p);

    p = HeapAlloc(GetProcessHeap(), 0, 10);
    printf("HeapAlloc, p=%p\n", p);

    p = GlobalAlloc(GMEM_FIXED, 10);
    printf("GlobalAlloc, p=%p\n", p);

    p = LocalAlloc(LMEM_FIXED, 10);
    printf("LocalAlloc, p=%p\n", p);

    getchar();

    return 0;
}
ビルドして実行します。
C:\tmp> cl /Od /Zi test.c
......

C:\tmp> test.exe
malloc, p=0000017EFA24A220
HeapAlloc, p=0000017EFA24A360
GlobalAlloc, p=0000017EFA24A620
LocalAlloc, p=0000017EFA24A4E0
WinDbg をアタッチし、メモリ確保時の呼び出し履歴を見てみます。
0:001> !heap -p -a 17EFA24A220  ★ malloc()
    address 0000017efa24a220 found in
    _HEAP @ 17efa230000
              HEAP_ENTRY Size Prev Flags            UserPtr UserSize - state
        0000017efa24a1f0 0004 0000  [00]   0000017efa24a220    0000a - (busy)
        7ffd157cd072 ntdll!RtlpAllocateHeapInternal+0x00000000000809e2  ★ RtlpAllocateHeapInternal()
        7ff7877ab674 test!_malloc_base+0x0000000000000044  ★ malloc()
        7ff7873c95ce test!main+0x000000000000000e
        7ff78775e1f8 test!__scrt_common_main_seh+0x000000000000010c
        7ffd145a257d KERNEL32!BaseThreadInitThunk+0x000000000000001d
        7ffd1576aa58 ntdll!RtlUserThreadStart+0x0000000000000028

0:001> !heap -p -a 017EFA24A360  ★ HeapAlloc()
    address 0000017efa24a360 found in
    _HEAP @ 17efa230000
              HEAP_ENTRY Size Prev Flags            UserPtr UserSize - state
        0000017efa24a330 0004 0000  [00]   0000017efa24a360    0000a - (busy)
        7ffd157cd072 ntdll!RtlpAllocateHeapInternal+0x00000000000809e2  ★ RtlpAllocateHeapInternal()
        7ff7873c95fb test!main+0x000000000000003b
        7ff78775e1f8 test!__scrt_common_main_seh+0x000000000000010c
        7ffd145a257d KERNEL32!BaseThreadInitThunk+0x000000000000001d
        7ffd1576aa58 ntdll!RtlUserThreadStart+0x0000000000000028

0:001> !heap -p -a 17EFA24A620  ★ GlobalAlloc()
    address 0000017efa24a620 found in
    _HEAP @ 17efa230000
              HEAP_ENTRY Size Prev Flags            UserPtr UserSize - state
        0000017efa24a5f0 0004 0000  [00]   0000017efa24a620    0000a - (busy)
        7ffd157cd072 ntdll!RtlpAllocateHeapInternal+0x00000000000809e2  ★ RtlpAllocateHeapInternal()
        7ffd13075ca1 KERNELBASE!GlobalAlloc+0x0000000000000081  ★ GlobalAlloc()
        7ff7873c961e test!main+0x000000000000005e
        7ff78775e1f8 test!__scrt_common_main_seh+0x000000000000010c
        7ffd145a257d KERNEL32!BaseThreadInitThunk+0x000000000000001d
        7ffd1576aa58 ntdll!RtlUserThreadStart+0x0000000000000028

0:001> !heap -p -a 17EFA24A4E0  ★ LocalAlloc()
    address 0000017efa24a4e0 found in
    _HEAP @ 17efa230000
              HEAP_ENTRY Size Prev Flags            UserPtr UserSize - state
        0000017efa24a4b0 0004 0000  [00]   0000017efa24a4e0    0000a - (busy)
        7ffd157cd072 ntdll!RtlpAllocateHeapInternal+0x00000000000809e2  ★ RtlpAllocateHeapInternal()
        7ffd1302d3fd KERNELBASE!LocalAlloc+0x000000000000006d  ★ LocalAlloc()
        7ff7873c9641 test!main+0x0000000000000081
        7ff78775e1f8 test!__scrt_common_main_seh+0x000000000000010c
        7ffd145a257d KERNEL32!BaseThreadInitThunk+0x000000000000001d
        7ffd1576aa58 ntdll!RtlUserThreadStart+0x0000000000000028
どのヒープメモリ確保関数でも、呼び出し履歴が表示されました。
また、どのヒープメモリ確保関数も結局は RtlpAllocateHeapInternal() に帰結していました。
おわりに
ヒープメモリ確保時の呼び出し履歴を保存・表示する方法について見てきました。
調査が終わったら GFlags でチェックボックスをすべて OFF にして [OK] ボタンを押し、レジストリの設定を消すのを忘れないようにしましょう。
参考文献
[1] マイクロソフト「GFlags」
https://learn.microsoft.com/ja-jp/windows-hardware/drivers/debugger/gflags
[2] マイクロソフト「RtlCaptureStackBackTrace 関数 (winnt.h)」
https://learn.microsoft.com/ja-jp/windows/win32/api/winnt/nf-winnt-rtlcapturestackbacktrace